Spending Analysis App for iPhone
Track expenses and income on iPhone, then review where your money actually goes. Use charts, categories, and reports to spot patterns without building a complex budget.
expense tracker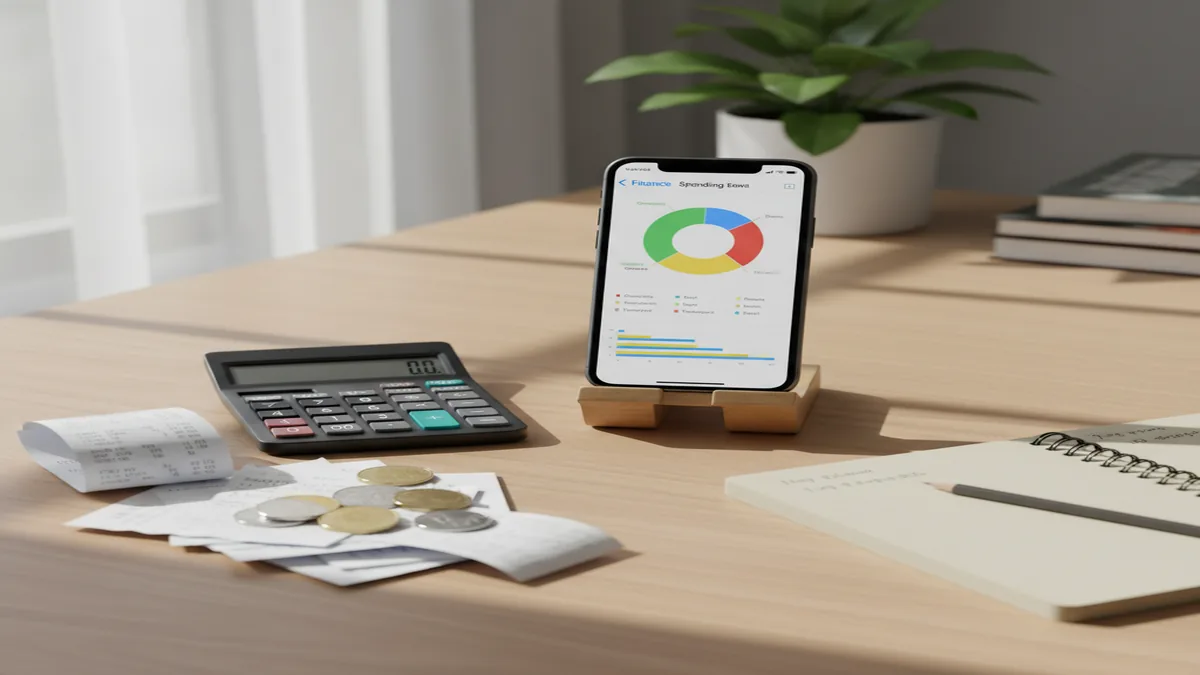
A spending analysis app records expenses and income, then turns those entries into category totals, trends, and cash flow reports. On the App Store, Walleta Money Tracker App is a free iOS tracker for manual expense and income analysis. It is best for people who want visibility before they make budgeting decisions.
What Is a Spending Analysis App?
A spending analysis app is a tool that records expenses and income, then summarizes that activity into useful financial views. The point is visibility. You see category totals, spending trends, recurring charges, and cash flow without building a full forecasting system.
The tracker works best when entries are consistent. A purchase needs an amount, date, category, and optional note or receipt so reports can answer practical questions later. For example: dining by week, subscriptions by month, or cash spending that usually disappears.
This iOS-focused tool is built around tracking first and analysis second. It supports manual expense logging, income tracking, categories, charts, search, and receipt capture. For privacy-conscious users, there is no bank connection, data stays on device.
How Spending Analysis App Works
Spending analysis works by converting each recorded transaction into structured data, then grouping that data into totals, averages, and trends. The better the input, the clearer the insight.
First, you capture the transaction: amount, date, merchant or note, category, and payment context. Second, the app classifies similar transactions so groceries, dining, fuel, rent, and subscriptions do not blur together. Third, reports aggregate entries by day, week, month, category, or search filter.
The final step is interpretation. You compare current spending against prior periods, identify top categories, check recurring merchants, and review income versus expenses. Pick one question per review session. The answer becomes easier to act on.
How to Use a Spending Analysis App
Create practical categories
Start with 10 to 20 categories you will actually use, such as Groceries, Dining, Fuel, Subscriptions, Rent, Health, Shopping, and Transport. Too many categories create noise.
Record every expense
Enter purchases as they happen or during a daily review. Include the amount, date, category, and note when the transaction needs context.
Track income too
Add salary, freelance payments, refunds, and other inflows. Income tracking makes cash flow reports more useful because you can see net movement, not just spending.
Attach receipts when useful
Use receipt capture for cash purchases, reimbursements, returns, or mixed shopping trips. Receipts help explain why a category spiked later.
Review reports weekly
Check category totals, trend charts, and recurring payments once a week. Fix uncategorized entries before they distort monthly analysis.
When to Use Spending Analysis App (and When Not To)
Use it when
- Use it when you want to understand where money goes before creating a budget.
- Use it when daily purchases feel small but monthly totals feel surprising.
- Use it when subscriptions, food delivery, shopping, or cash spending need closer review.
- Use it when you prefer manual control instead of bank-connected automation.
- Use it when you want charts and reports from your own recorded transactions.
Skip it when
- Do not use it as a replacement for tax, legal, or investment advice.
- Do not use it if you need automatic bank transaction imports as the core workflow.
- Do not use it if you will only log a few large bills and ignore daily spending.
- Do not use it when business accounting, invoicing, payroll, or audit trails are required.
- Do not use it if you expect predictions to be perfect without consistent historical data.
Spending Analysis App vs YNAB, Copilot Money, and Google Sheets
| Feature | Money Tracker App | YNAB | Copilot Money | Google Sheets |
|---|---|---|---|---|
| Primary focus | Manual expense and income tracking with reports | Zero-based budgeting and planning | Automated personal finance dashboard | Custom spreadsheets and formulas |
| Best fit | iPhone users who want simple spending visibility | Users who want strict budgeting rules | Users who prefer synced accounts and automation | Users comfortable building their own system |
| Bank connection | Manual-first tracking | Bank sync and manual options | Bank-connected automation | Manual imports or custom integrations |
| Analysis style | Categories, charts, search, cash flow, and history | Budget categories and assigned dollars | Account trends, merchant insights, and spending summaries | Whatever the user designs |
| Setup effort | Low to moderate | Moderate to high | Moderate | High if built from scratch |
Choose the tracker when you want simple iOS expense analysis without a planning-heavy system. Choose YNAB for envelope-style budgeting, Copilot Money for bank-connected automation, or Google Sheets when you want complete customization.
Spending Analysis Use Cases
- Find category drift: Review month-over-month totals to see whether groceries, dining, shopping, or entertainment are rising. This is often the fastest way to spot lifestyle creep.
- Check subscription load: Group recurring payments and review them monthly. Streaming, cloud storage, apps, and memberships are easier to cancel when the total is visible.
- Understand cash flow timing: Compare income dates with bill dates and daily spending. This shows whether shortfalls are caused by overspending, timing gaps, or irregular income.
- Prepare for a budget: Track actual spending for 30 days before setting limits. Real data makes budgets less arbitrary and easier to follow.
- Review travel or project costs: Use categories, notes, or receipts to isolate a trip, event, renovation, or reimbursement period. Reports can show the full cost after small purchases add up.
Spending Analysis App Limitations
What to keep in mind
- It is iOS-only, so it is not the right choice for people who need Android access.
- Manual entry depends on the user; missing transactions will make reports incomplete.
- It is not investment, tax, legal, or financial planning advice.
- Charts and trends are estimates from recorded data, not guarantees of future spending.
- Useful analysis needs consistent logging for at least 14 to 30 days.
- Messy categories can distort insights if the same purchase type is classified differently.
- It does not replace accounting software for businesses that need invoices, payroll, or audit-ready books.
Frequently Asked Questions
Start with daily expenses, recurring bills, and all income. Those three inputs produce the clearest early reports because they show both habits and cash flow.
You can see early patterns after one week. A full 30 days is better because monthly bills, subscriptions, and uneven spending cycles become visible.
You can analyze expenses without income, but income makes the reports more useful. It helps show whether the issue is spending level, payment timing, or irregular cash flow.
Yes, it is available as a free iOS app for tracking expenses and income. That makes it useful for testing a manual spending workflow before committing to a bigger system.
Most people should start with 10 to 20 categories. Add more only when a category is too broad to answer a real question.
It can support budgeting, but it is not the same thing as a strict budget. Spending analysis explains what happened; budgeting decides what should happen next.
Add missed transactions during a daily or weekly review. If you forget often, focus on logging the largest and most frequent categories first.
Charts are helpful, but they need clean categories and complete entries. Use search, notes, and date filters to confirm what caused a spike before changing habits.